8D problem solving: the visual evidence a supplier needs
In automotive, the cost of a defective part is rarely the part itself. It is the questions that follow. This post walks through 8D problem solving step by step and shows where part-level visual records strengthen the supplier's hand.
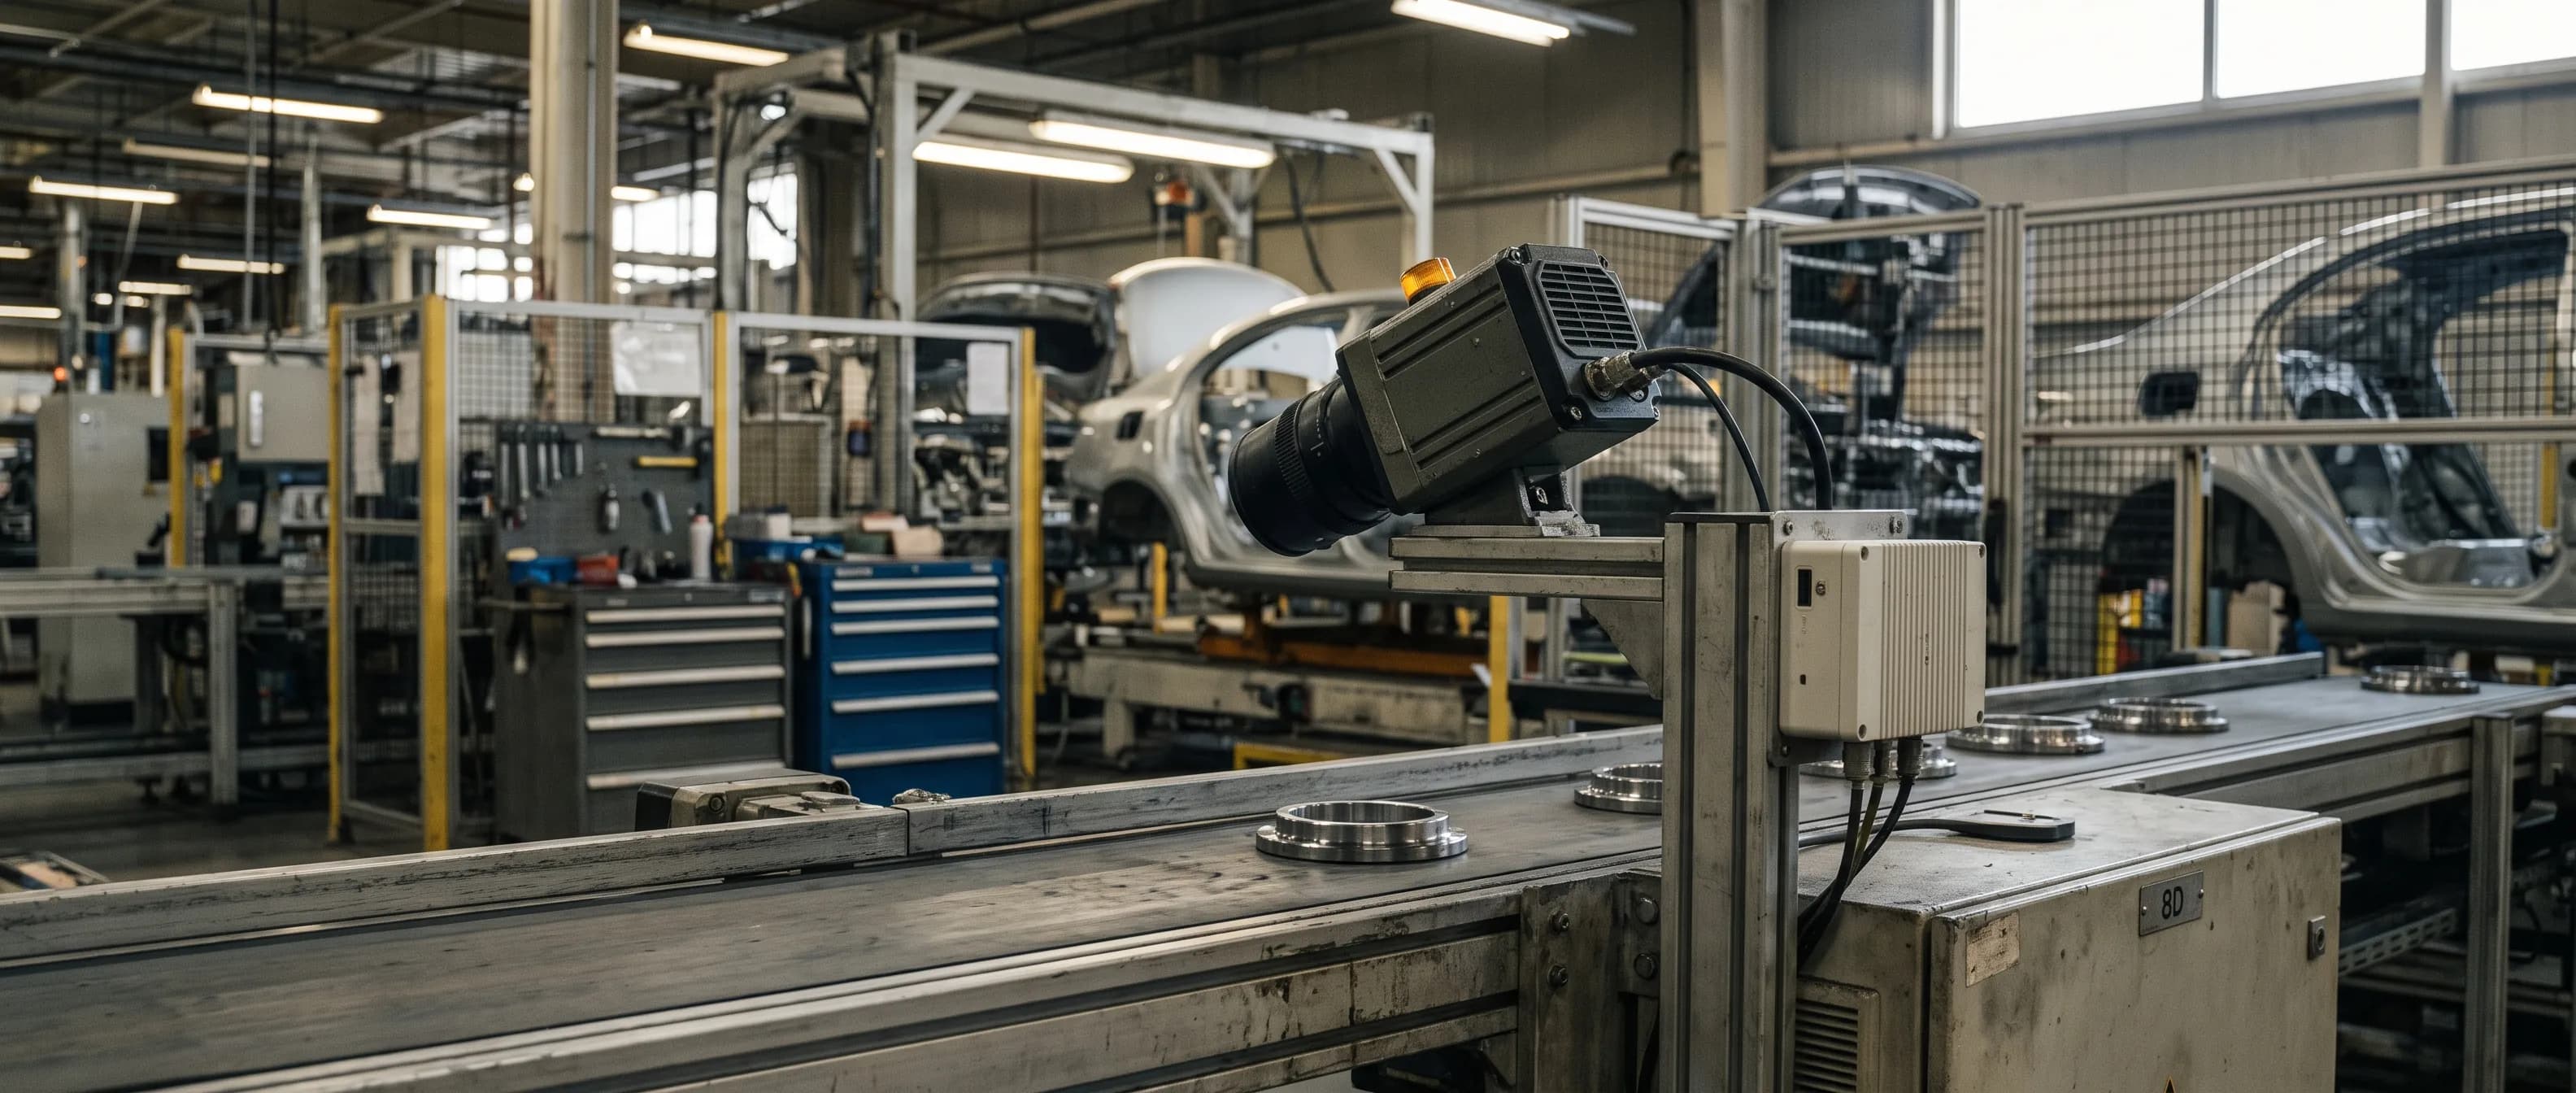
In automotive, the cost of a defective part is rarely the part itself. It is the questions that follow. This post walks through 8D problem solving step by step and shows where part-level visual records strengthen the supplier's hand.
Anyone in an automotive supplier's quality department knows how it goes. One defective part found on the OEM's assembly line is not measured by its price. The line may stop, the lot goes into quarantine, the customer asks for a sorting team, and then comes the familiar request: an 8D report, and with it a full round of 8D problem solving.
The defect is often tiny: a burr on a machined edge, a nick on a metal ring, a stain on a visible face. Everything is in tolerance on the dimensional report, yet the part cuts a seal or stands out at receiving inspection.
8D is a structure for closing a problem with discipline. Quality management systems such as IATF 16949 and approval processes such as PPAP rest on the same principles: traceability and recorded evidence. Below we look at what the supplier has in hand at each step, and what it could have.
What is 8D problem solving?
8D problem solving is a structured method for closing a customer complaint in eight disciplines, from forming a team to recognizing it. It asks two separate questions about every defect: why it occurred and why it escaped. Its strength depends on evidence, so the quality of your records largely decides the quality of your 8D report.
The right-hand columns show what changes when every part has a visual record.
| Discipline | What it asks | Without part-level records | With part-level records |
|---|---|---|---|
| D1 Team | Who works the problem? | Same | Same |
| D2 Problem description | What, where, when, how many? | Sample forms, estimates | Image, timestamp, part sequence number |
| D3 Containment | Which parts are affected? | "All of them," broad sorting | Scope narrowed to when the defect was first flagged |
| D4 Root cause | Why did it occur, why did it escape? | "The operator missed it" | Defect type and time pattern, link to tooling |
| D5 Permanent corrective action | How do we close the escape point? | Operator retraining | 100% in-line inspection |
| D6 Implement and validate | Does the fix work? | A statement | Periodic NG reports |
| D7 Prevent recurrence | Will it stay fixed? | Procedure update | Trend data by defect type and shift |
| D8 Recognize the team | Close and acknowledge | Same | Same |
D2: "What exactly did you see?"
In D2 the problem is described precisely: which part, which defect, where, when, how many. Evidence is what makes this step strong. If the supplier only has sample forms, it has nothing to say about the thousands of parts between samples.
The customer has a photo and a lot number. The supplier has shift check sheets saying "samples conformed." But a burr is not constant. It appears as a cutting tool wears, runs for a while, and disappears when the tool is changed. A defect that comes and goes between two samples never existed on paper.
With part-level visual records the picture changes. Each part's image, with any defect marked, is stored with a timestamp and its sequence number on the line. ISEE Vision's automotive part quality control station keeps exactly this record: it identifies the sequence number of the part carrying the anomaly. "Was the defect the customer found flagged on our line?" is answered from the record, not a guess.
D3: "How many parts are affected, and where?"
In containment the first question is where the affected parts are. Without information, the safe answer is "all of them." With part-level records, the scope can be narrowed to when the defect was first flagged and the shifts where it clustered.
"All of them" means sorting teams, checking stock in transit and in the warehouse, maybe re-inspecting days of production. The 1-10-100 rule (Labovitz, Chang, and Rosansky, Making Quality Work, 1992) sums it up: preventing a defect at the source costs 1, sorting later costs 10, fixing it at the customer costs 100. The numbers are an order of magnitude, and in automotive the "100" is often modest.
With records you can draw a more defensible boundary than "all." Getting the customer to accept it is still your quality team's job, but now it has something to stand on.
D4: Why did it occur, and why did it escape?
The root-cause step wants two answers: why the defect occurred and why it escaped detection. Occurrence usually traces to the machine, tool, or die. Escape traces to the inspection method, and in most plants the answer is visual checking that relies on samples and the human eye.
A repeating defect often signals a worn tool or die, as covered in our post on die maintenance and press part cracks.
On the escape side, the answer is usually "visual inspection was done by the operator and the defect was missed." That is a fact, not blame. In a Sandia National Laboratories study, 82 inspectors checked 140 precision-manufactured nuclear-weapons parts for eight defect types and correctly rejected 85% of the defective items (See, Human Factors, 2015). The author calls this "not vastly superior to the industry average of 80%," so typical visual inspection lets roughly one defect in five through. That hit rate also came with 35% of good parts rejected, a high scrap rate the author says is not typically observed.
Seeing the same part thousands of times per shift makes it harder: since Mackworth's classic experiments in 1948, we have known that detection drops noticeably from roughly the first half hour of a monotonous monitoring task. Meanwhile "operator retrained" is losing credibility as a corrective action, and a repeat defect makes the second 8D much tougher.
D5 and D6: moving the escape point from people to a system in 8D problem solving
For a permanent corrective action to convince, the escape point has to close. The strongest way is to move from sampling to a system that inspects every part on the line. The type of system matters: on a line running many part numbers, building a defect library for each one is not practical.
Learning the good part
Collecting hundreds of defective samples per part number is unrealistic, and the next complaint may bring a defect type nobody has seen. So ISEE Vision's AI visual inspection system learns what a good part looks like, not the defects. Every part is compared with that perfect reference in real time. Deviating regions are marked on an anomaly heatmap and given a numeric confidence score, and the part is classed NG or OK against the threshold you set per product. Background is in our post on anomaly detection and its industrial applications.
Several defects in one frame are each marked and labeled by type. Parts flowing in series, such as metal rings, are numbered as they pass.
What gets inspected on an automotive line?
The automotive line of ISEE Vision Anomaly Detection, part of its automated visual inspection family, covers chassis, sheet metal, interior trim, exterior hardware, engine, and transmission parts. It integrates with robot arms, press machines, and mass-production lines, and handles up to 250 m/min. Processing is on the device and data stays on site. Precision goes down to 6 µm depending on the optical configuration.
| Defect | Typical appearance | The question it raises in an 8D |
|---|---|---|
| Burr, flash | Excess material on an edge or hole | "Why did it cut the seal in assembly?" |
| Crack | Thin line in a bend or formed area | "Die or material?" |
| Scratch, paint defect | Mark, color, or gloss difference on a visible face | "Why did receiving inspection reject it?" |
| Bending, angle, dimensional deviation | Visible departure from reference geometry | "Why didn't the part seat?" |
| Missing part (presence/absence) | A clip, nut, or seal not there | "How did an incomplete assembly ship?" |
The missing-part check matters: an assembly missing a clip passes the dimensional report but can stop the customer's line.
What happens when a defect is found?
You choose: alert only, alert plus line stop, or full automation. The operator is alerted on screen, by tower light, or by siren, and an email notification can go to the people responsible. With a diverter, a PLC or relay signal sends the NG part to a reject bin, and the line can stop through the same outputs. Whether the part is scrapped, reworked, or accepted stays with your quality lead.
New part numbers are taught on site with good samples and stored per product code. Switching back to a saved part means selecting it on the panel, with no mechanical adjustment or reinstallation.
D6 and D7: how do you prove the fix works?
The customer wants proof that the action works and recurrence is prevented. "We installed a system" is not enough; periodic reports provide the data.
For every NG decision, the original image, heatmap, confidence score, and timestamp are stored. Daily, weekly, and monthly reports show how many NGs were flagged, with distribution analysis by defect type, product code, and shift.
Internally, burr flags that rise after a certain hour point to the tool-life plan. The records support IATF 16949 audits and PPAP documentation, but they don't deliver compliance on their own. Compliance depends on your whole quality system.
Frequently asked questions
What does a visual inspection record add to an 8D report?
It shows whether the defective part was flagged on the line, when the defect first appeared, and which shift it clustered in. That helps narrow containment scope and prove the action worked.
Can it catch a defect type nobody has seen before?
Yes, because it works from a reference of the good part, not a defect catalog. Any region that deviates from the reference is marked, seen before or not. The threshold and your quality team decide whether it is acceptable.
Can it check for a missing clip or nut?
Yes. Presence/absence inspection flags an element that is in the reference but missing from the image, and the record shows the sequence number of the part.
Does visual inspection make us IATF 16949 compliant?
Not on its own. Part-level visual records strengthen traceability and audit evidence, but compliance depends on your whole quality management system.
Key takeaways
- Sample forms say nothing about the thousands of parts between samples. A defect can appear and disappear in that gap.
- Even in a controlled study, inspectors caught 85% of defective parts, against a reported industry average of about 80%. "Operator retrained" alone is not a convincing corrective action.
- A system that learns the good part inspects every part on multi-part-number lines without a defect library and records which part showed what.
- In 8D problem solving, being able to say "every part in this lot was inspected, here is the record" is a strong position even when nothing escaped.
If you have a part that already brought you an 8D, let's start there. Send good and defective samples for a free trial and we'll look together at how the system sees that defect: contact us to set up a trial.
Contact: info@isee-vision.com · +90 216 455 95 44