Line image
INPUT · RAW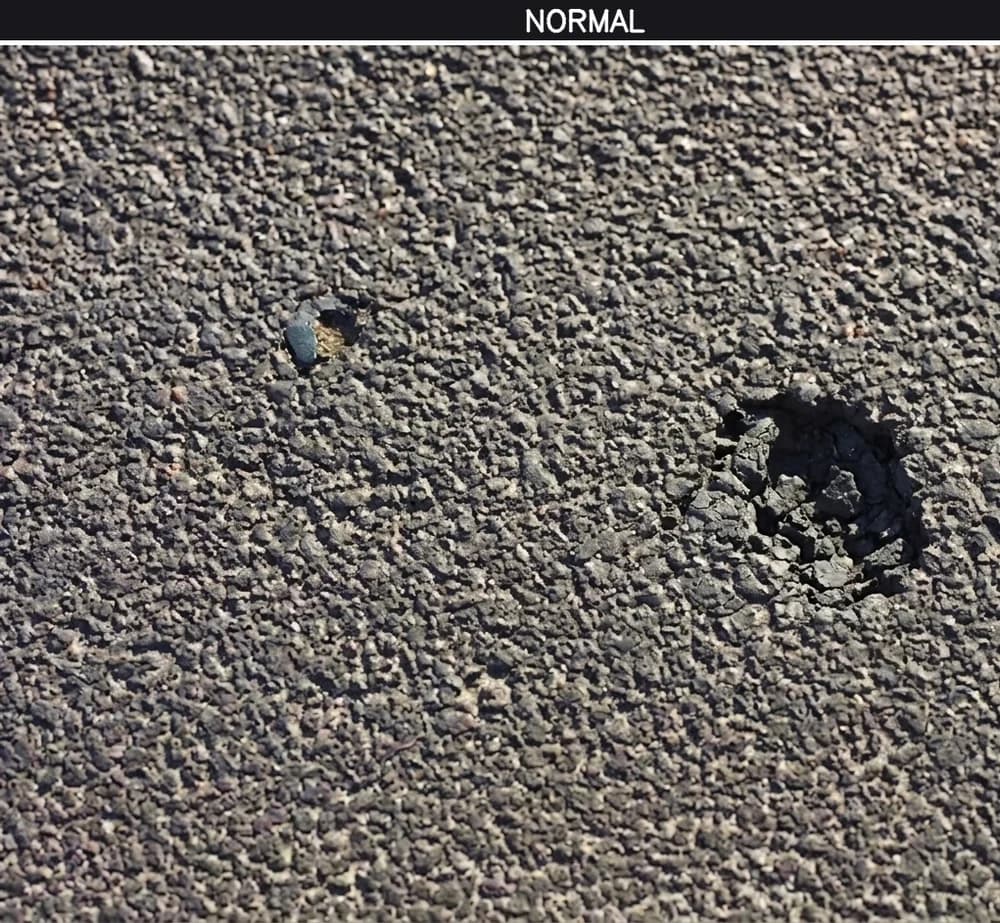
Unprocessed camera image of the product passing through the line.
A light-isolated edge station installed on ceramic, profile, board, and concrete product lines compares every product with a learned perfect reference in real time. It catches cracks, porosity, burrs, and color deviations, checks dimensional tolerance, and raises an alert or a sorting signal on a defective product.
 LIVE · LINE 01INSPECTION ACTIVELINE EXIT · CONVEYOR
Technical Specifications
| Installation | Light- and dust-sealed enclosed station above the conveyor |
|---|---|
| Inspection method | Real-time comparison against a perfect reference product |
| Processing | Edge / on-device — no cloud dependency |
| Surface types | Concrete and plaster · ceramic · glass · profile · board · precast element |
| Detected defects | Cracks, porosity, chips, burrs, stains, glaze defects, spalling, color deviation |
| Dimensional checks | Length, width, thickness, squareness, and cross-section geometry |
| Site conditions | Sealed housing against dust, vibration, and variable ambient light |
| Precision | Down to 6 microns depending on the optical configuration |
| Anomaly threshold | Customer-adjustable sensitivity and acceptance limit |
| Defect classification | Type-based labels (crack / porosity / burr / tone difference, etc.) |
| Quality grading | Class separation and sorting signal based on tone and defect density |
| Action outputs | Line stop · siren / light · PLC / relay · operator notification |
| Logging & reports | Time-stamped images · daily / weekly / monthly reports |
| Visual evidence | Original image + anomaly heatmap + confidence score |
| Integration | Added to an existing production line as an independent station |
Reference · Comparison
A reference product meeting your acceptance criteria is introduced to the system first. That reference holds the surface texture, color tone, and cross-section geometry. Every product on the line is compared against this profile; deviations are marked on an anomaly map and converted into a numeric confidence score. Thanks to the enclosed housing, this comparison works with the same accuracy even in dusty environments with changing light.
Unprocessed camera image of the product passing through the line.
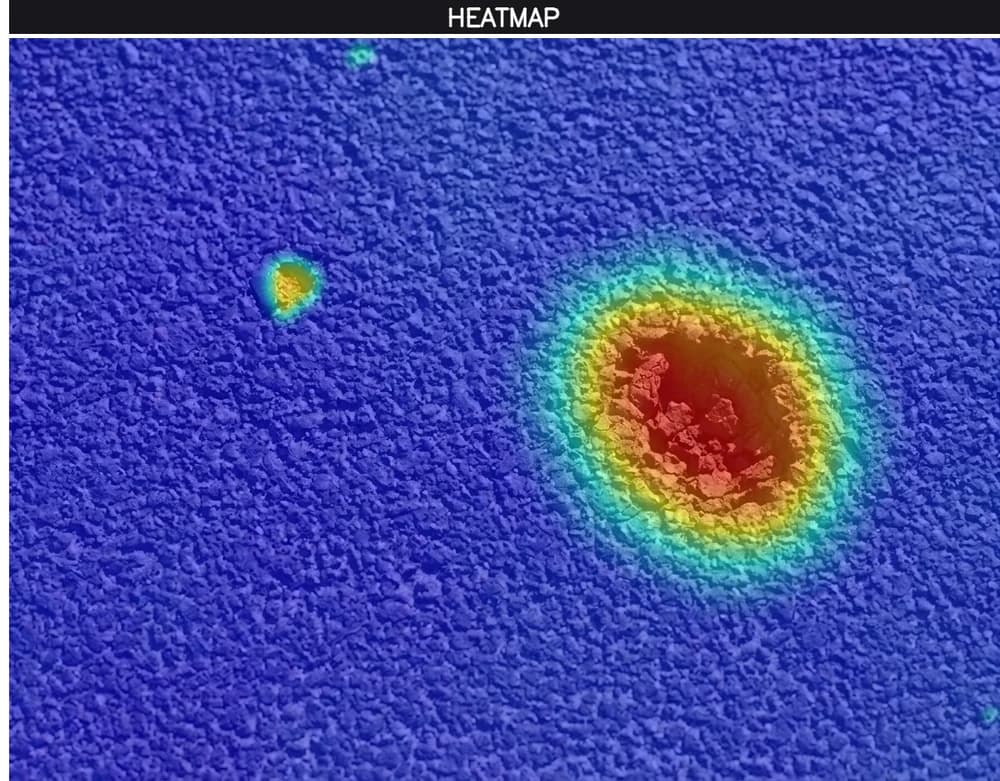
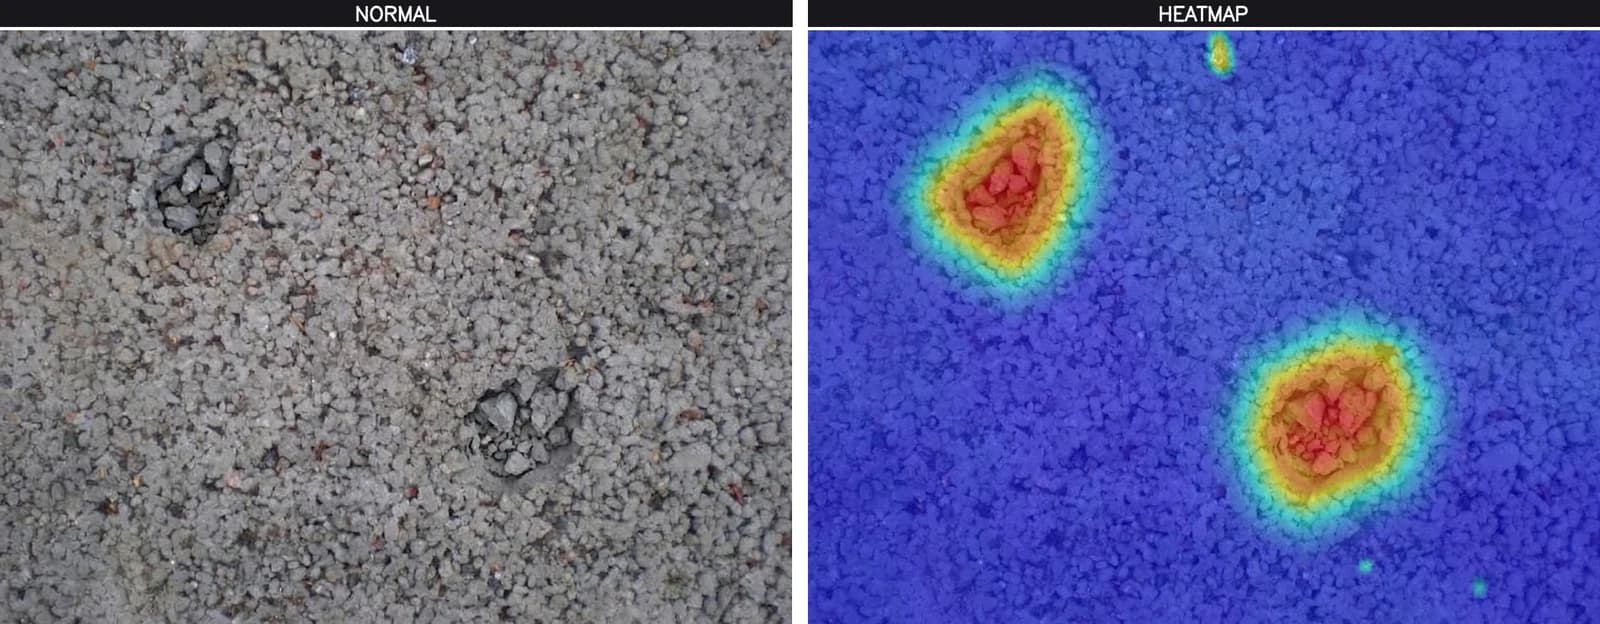
The region deviating from the reference is marked and its score checked against the acceptance threshold.
Core Capabilities
A perfect product is learned and every deviation is measured against it.
Stable imaging is maintained under dust, vibration, and changing light.
On-device analysis preserves low latency and data privacy.
Length, width, thickness, and squareness deviations are measured automatically.
Products are sorted into classes by defect density and tone difference.
Sensitivity and acceptance limits are configured per product type.
Defects are labeled as cracks, porosity, chips, burrs, and tone differences.
The source image, heatmap, and confidence score are stored together.
Added to the line as an independent inspection station.
How It Works
The perfect product's surface, color, and cross-section profile is saved with the product code.
Every product is imaged under controlled lighting inside the enclosure.
Deviations are mapped and converted into a confidence score.
When the threshold is exceeded, the system alerts or grades and sorts the product.
From the Field · Detections
The examples below show anomaly heatmaps produced by the system.
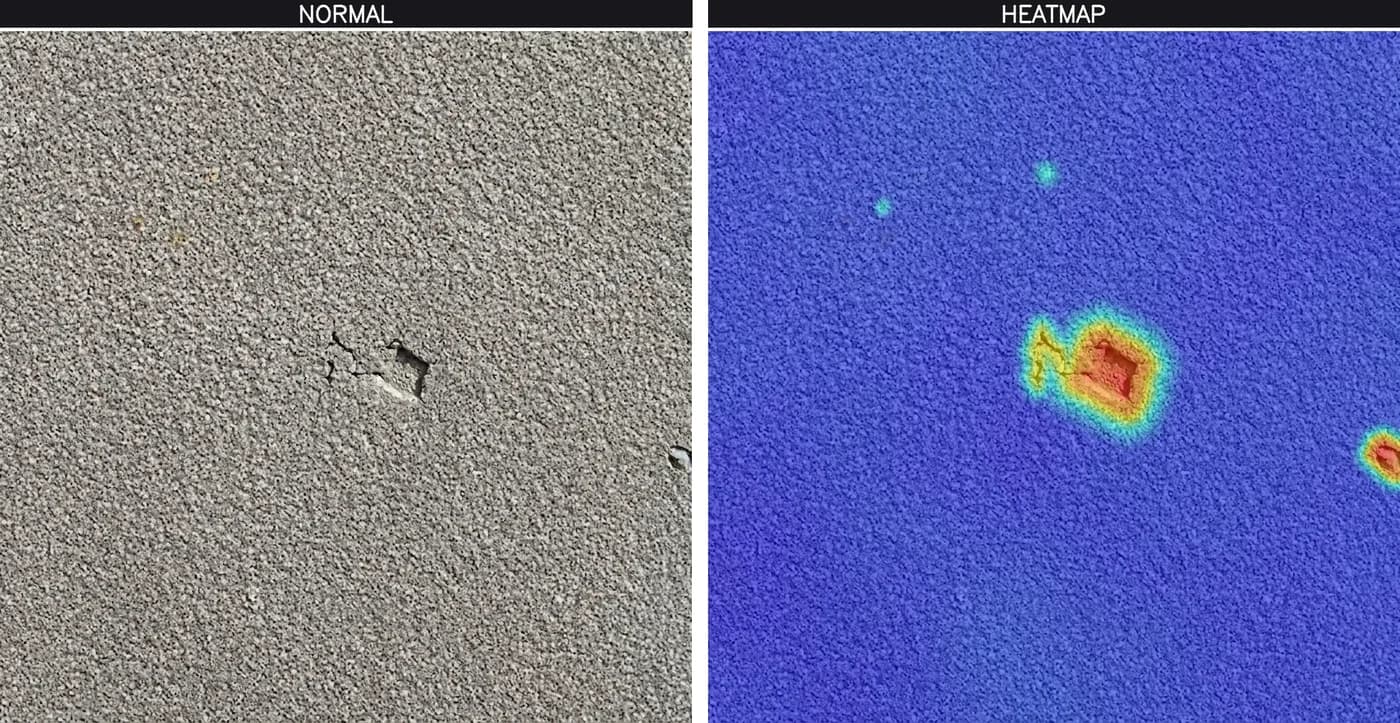
ORIGINAL + HEATMAP
Surface crack — loss of continuity in the edge region.
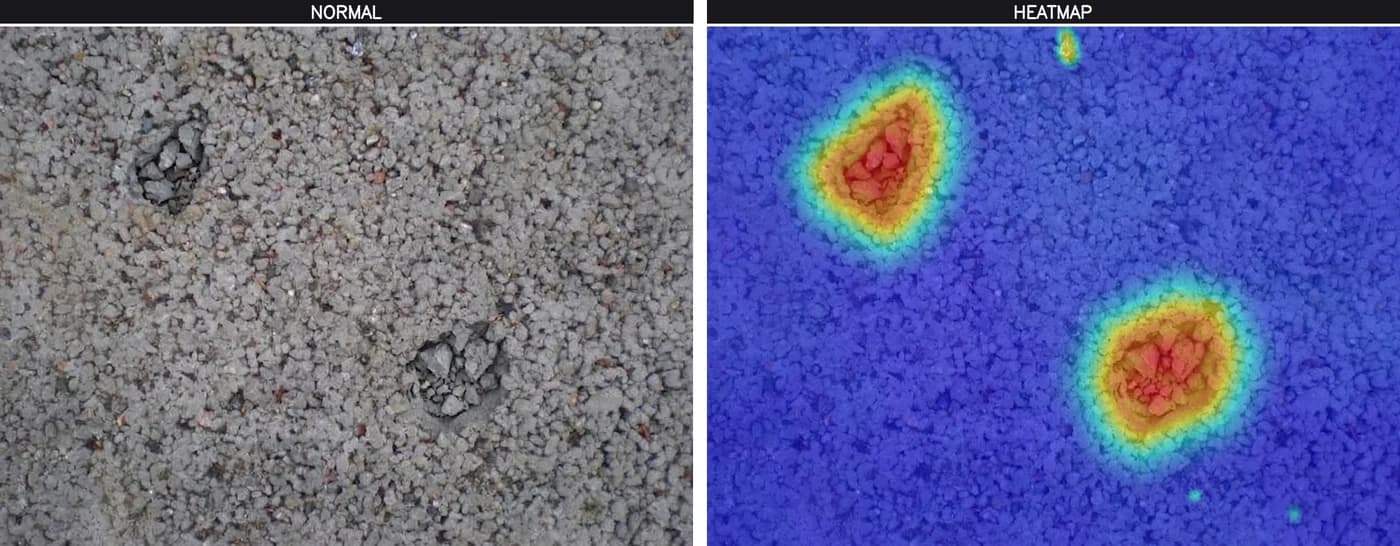
ORIGINAL + HEATMAP
Porosity density — local cluster of voids on the surface.
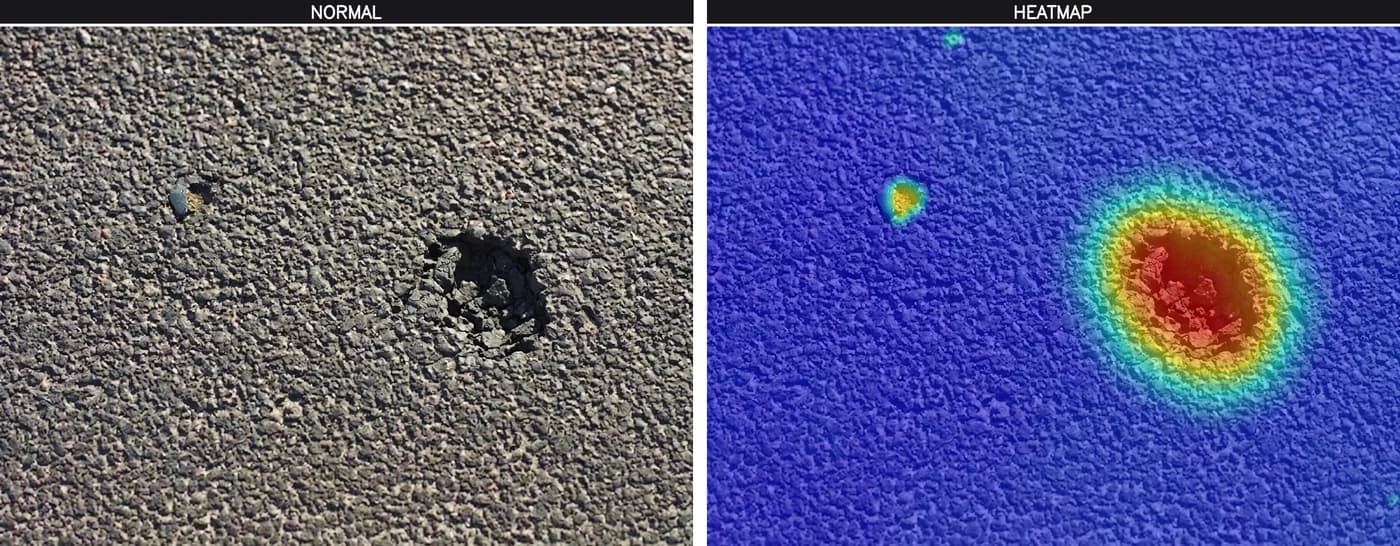
ORIGINAL + HEATMAP
Surface chip — local material loss and spalling.
Detected Anomalies
Surface, coating, and geometry are all inspected in the same pass, against the same reference.
Cracks, porosity, chips, burrs, and stains; deviations that break surface integrity.
Glaze defects, uneven paint, tone differences, and pattern distortions.
Out-of-tolerance deviations in length, width, thickness, squareness, and cross-section geometry.
Action Outputs
Alert only, alert plus stop, or full automation—the system is configured for your production scenario.
Automatically stops the line through relay / PLC integration.
Immediately warns the operator with a siren or alarm.
Signals with a lamp or tower light.
Shows the alert and defect image on screen.
Provides outputs compatible with existing automation.
Time-stamps detections and includes them in periodic reports.
Line Integration
The enclosure is positioned directly above the conveyor.
Products are saved by product code and recalled quickly.
Stable images are captured in harsh site conditions.
PLC and relay outputs plus grading signals connect to existing infrastructure.
Any product that travels along a conveyor or extrusion line, or is checked in a fixed cell, can be inspected. Defects, presence–absence, dimension, angle, shape, fill level, and surface — in short, every deviation beyond the defined standard is detected.
Configured for your line
Tell us about your product, line speed, and acceptance criteria. We'll propose the right installation, thresholds, and action scenario.